Introduction
The purpose of this program is to display how to create visualizations of the flow of spread for datasets without trajectory information, such as the Covid-19 dataset. In order to extract the the flow of data we use the method proposed in the paper "Data Flow Analysis and Visualization for Spatiotemporal Statistical Data without Trajectory Information". This is done in a three way step starting from calculating the 2D kernel density estimation before converting it into a gravity based flow model and then visualizing it.
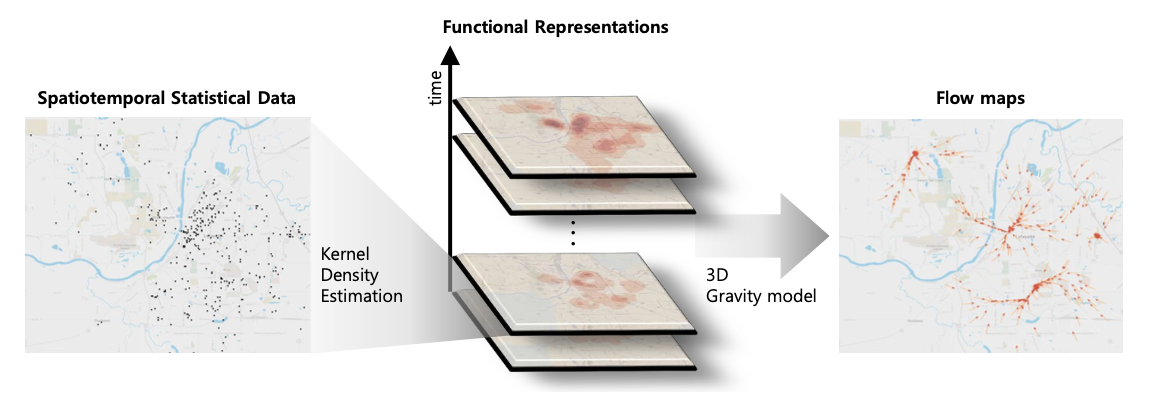
Fig 1. Visual overview of the system.
Running program
Jupyter Notebook is the easiest approach is to run a notebook server in your local machine (such as conda). The information on how to install this server can be found here. Once it is installed and running, the Vis2_Project.ipynb should be opened. You can also run the notebook from the link below in colab. Inside the code blocks of the program can be found, and more importantly the visualizations generated are directly represented apart from being stored. You can change values for `date1` and `date2` in order to get a new flow map for the given dates. For running the program the easiest way is Runtime -> Run All (Ctrl + F9)
Application
Spread of Covid-19 through 23-24 of January 2020

Fig 2. 2D KDE of Covid-19 spread a.) for 23th of January, b.) for 24th of January c.) flow map for 23-24th of January.
Spread of Covid-19 through 25-26th of January 2020

Fig 3. 2D KDE of Covid-19 spread a.) for 25th of January, b.) for 26th of January c.) flow map for 25-26th of January.
Dataset
Dataset consists of data of Covid19 spread across world, we use the data that are gathered for each confirmed pacient in China that includes coordinates of the pacient, it consists 14216 rows and 45 columns and it is updated daily. Preprocessing includes deletion of unnecessary columns, deletion of rows that have missing values in longitude or latitude.